
[ UPDATE July 2016 – I no longer subscribe completely to the concept of capacity planning, at least to this level of detail. I will keep this post available, but I will not maintain the fancy spreadsheet 😉 It’s fun to geek out with numbers and formulas, but we could do better having meaningful conversations with our teams. ]
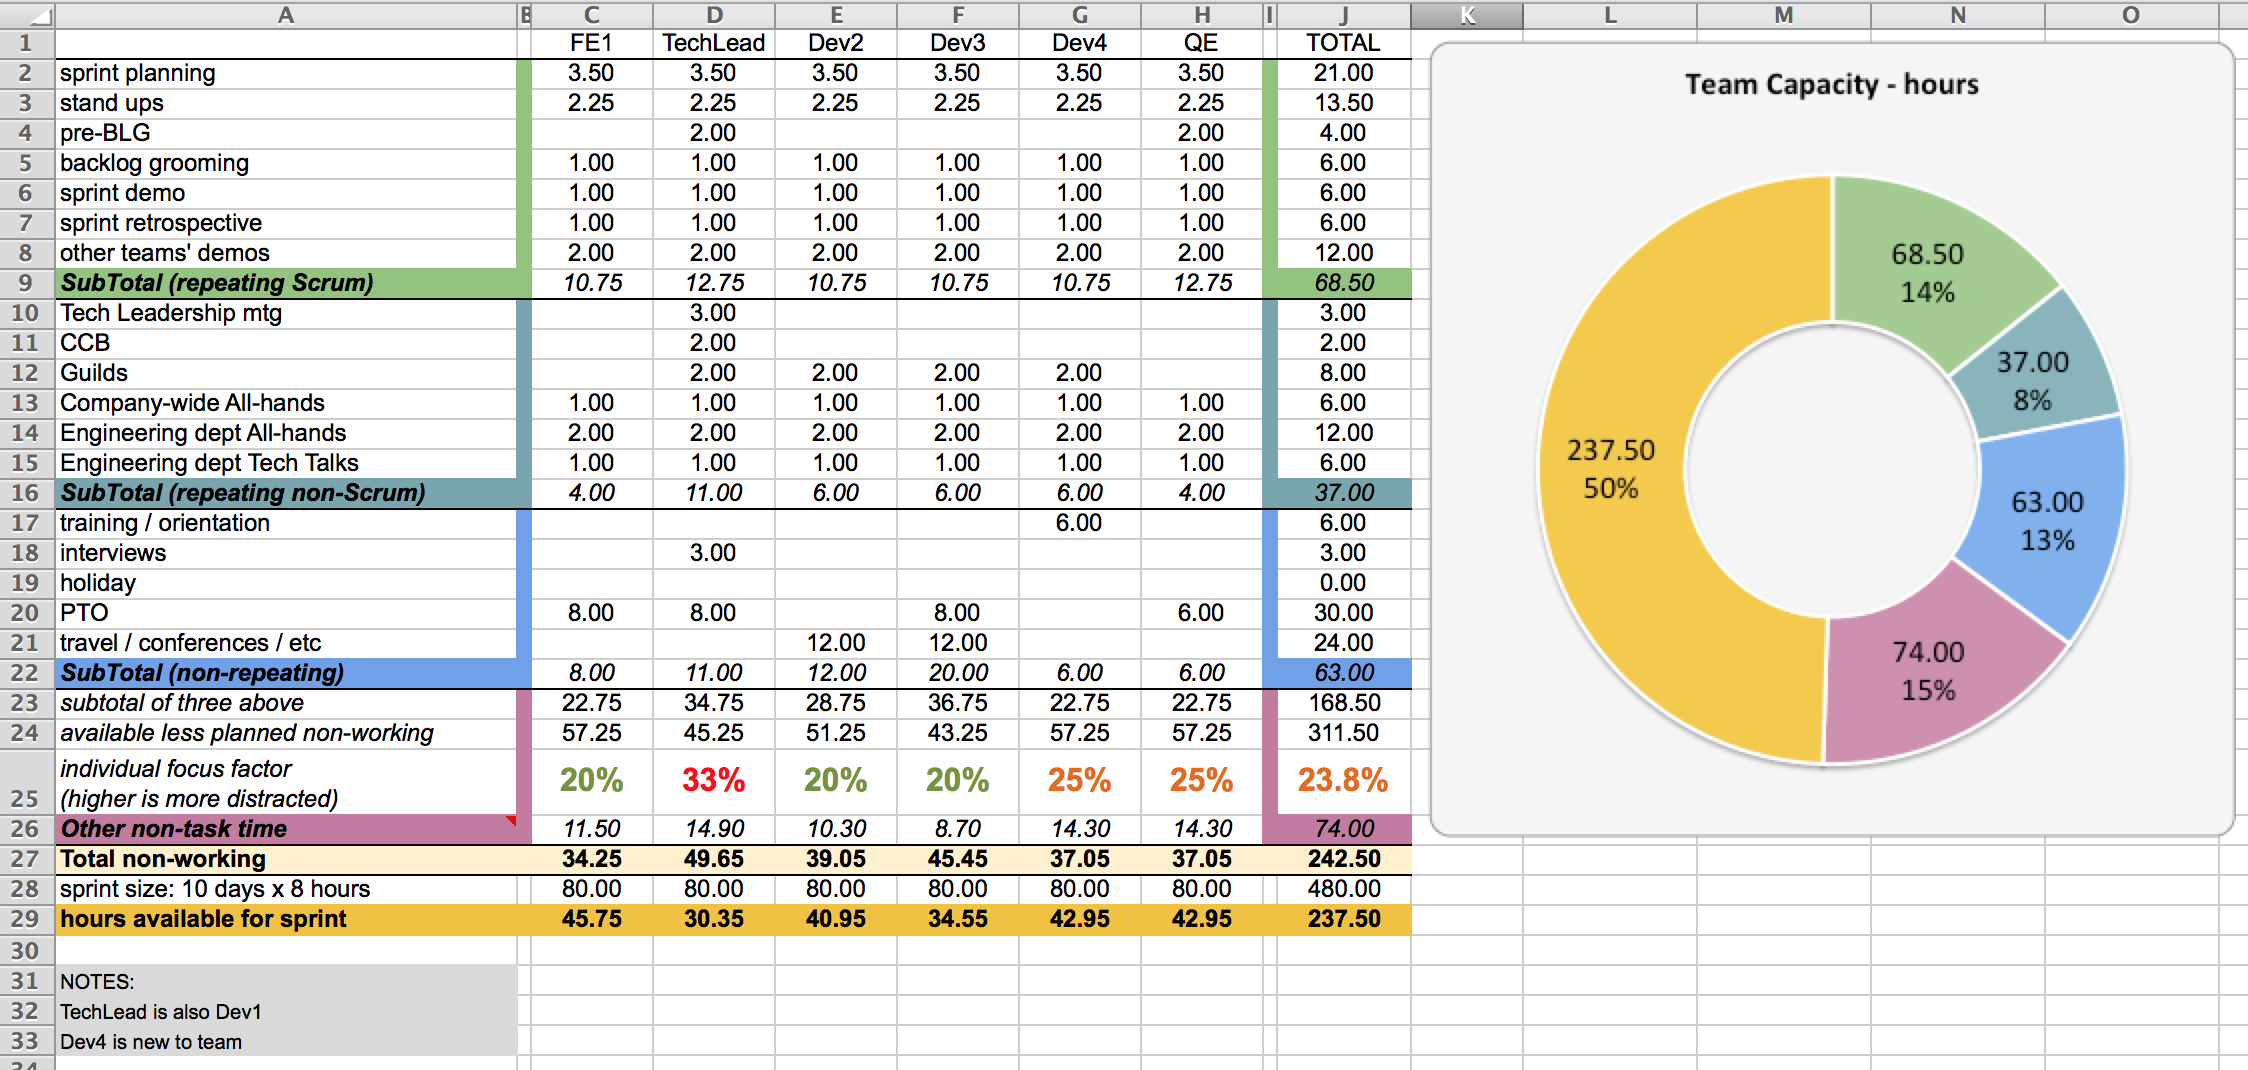
The topic of Capacity Planning came up in a recent coffee, and I decided to introduce it to my new team. I just developed a spreadsheet (illustration below) that helps make visible the number of hours that each team member is committed to for various activities not related to actual work on user stories and defects. The purpose for doing this was to make everyone aware of their overhead before they commit to a sprint.
I was introduced to the concept of making capacity transparent at the start of each sprint when SendGrid did the initial Agile transformation. I was especially drawn to the focus factor (though we didn’t use that term at SG) which accounts for the hard-to-quantify time that an individual loses each day to tasks such as checking emails, impromptu discussions, unplanned meetings, helping teammates, etc. For focus factor, we plugged in a flat value of about 25% of each person’s day, but the more I consider it, I now prefer using a range (eg. from 15-30%) specific to each team member. This factor may also may change over time (eg. sprint to sprint or day to day).
The hours in the worksheet (full size image below) are all based on a two-week sprint, so how many hours for activity x are consumed in 14 days.
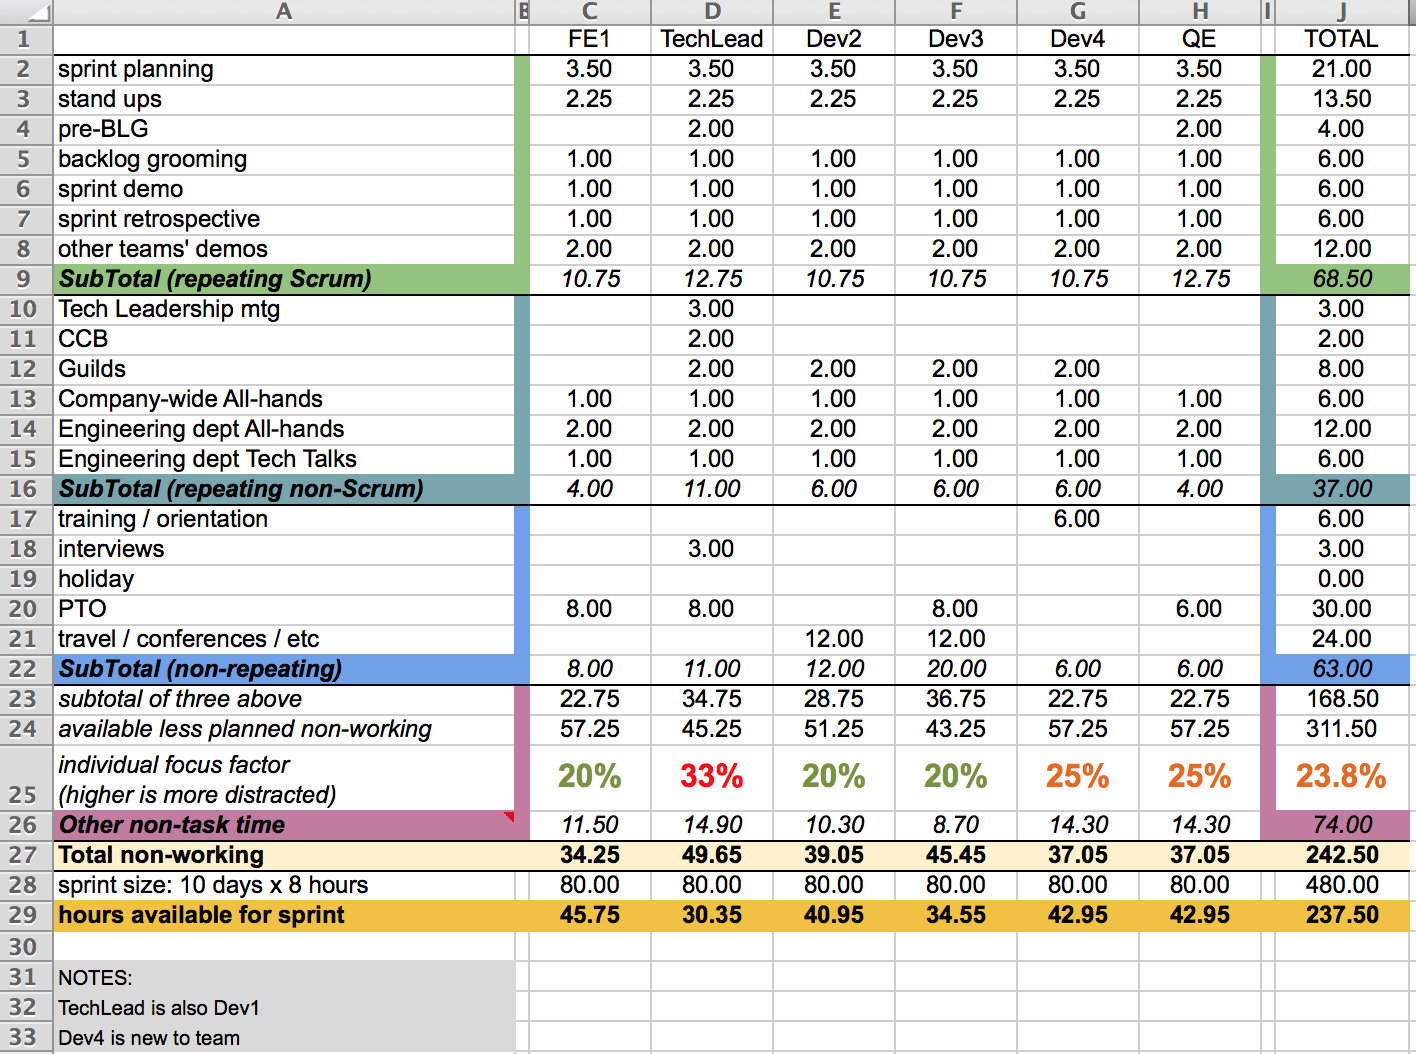
I’m going to walk through the rows in some detail here:
- Columns C – H represent six individual contributors on a Scrum team. The team’s Tech Lead attends more meetings and is interrupted more than other members. Dev4 is a new team member and is attending orientations and trainings.
- Rows 2 – 8 are related to Scrum ceremonies that are repeating and predictable over the two-week sprint.
- Rows 10 – 15 are related to non-Scrum activities scheduled by the company, department or guilds that are repeating and predictable over the two-week sprint.
- Rows 17 – 21 are non-repeating and unpredictable. The ScrumMaster solicits each member’s hours in this category at the start of the Sprint Planning session.
- Row 26 represents the unknown, unquantifiable “soup” that consumes our working days (described above). The focus factor (row 25) changes for each team member, and the higher the percent value, the more the member is expected to be distracted. This percent value is applied to the hours remaining outside of those already accounted for in the above three categories.
- Row 27 is the sum (in hours) of each of the above four categories.
Note that (for this sample team) no account is made for any team members splitting their time between projects (eg. the FE developer is 100% allocated to this team). Also, the focus factor isn’t adjusted for multi-tasking between an unreasonable number of stories (ie. this model assumes an individual WIP limit of 1 or 2) with the possible exception of the Tech Lead.
[update 5/15/15] Here’s a download of the Team Capacity Worksheet (.xls). I offer this download with no guarantees that it will work on your OS, and I will not be updating it or converting it to other formats.
I welcome comments below or on twitter using #capacityworksheet

Hi Vic,
I really like this! Would it be possible to get a copy of the file?
Best,
chuck
Can I get a copy of this file ASAP.
Thank you,
Vinay
I like this as well! Can I get a copy of the spreadsheet?
I like this template a lot as well. Is this tracking tool still in use today or have you gone to another tool? Can you share the template?
Thanks,
Will
I enjoyed making this, but I honestly don’t use it as much these days. It’s handy for visualizing where our hours are spent, and management likes it for justifying spending & hiring.
This is really good. Am I able to get a copy of this from you? Please?
I just saw the download link :-). Thank you. Excellent work
Thanks K. Glad you like it.
Thank you for the downloadable version of this. I am finding as I add more hours to the non-scrum rows, that the Focus Factor % is reducing. Are you sure the “higher the number” the more distraction? I’m adding more distractions and the number is going much lower.
I like this… can I get a copy to use please
All you have do is click on “Here’s a download of the Team Capacity Worksheet (.xls)”.
This is fantastic
Hi Can i get a copy
Hi,
Why don’t you use it as much these days?
thanks.
Is it possible to get the spreadsheet still?
Yep, it’s still on the page near the bottom. I’ve long since stopped using this and instead learned to talk with my teams instead 😉
Very good document, I started to use ASAP (From Brazil)
Thanks. It’s informative.
Glad it helped.
Hello… this is great!
Any chance of getting a copy?